Great stories have a personality. Consider telling a great story that provides personality. Writing a story with personality for potential clients will assist with making a relationship connection. This shows up in small quirks like word choices or phrases. Write from your point of view, not from someone else's experience.
Great stories are for everyone even when only written for just one person. If you try to write with a wide, general audience in mind, your story will sound fake and lack emotion. No one will be interested. Write for one person. If it’s genuine for the one, it’s genuine for the rest.
That simple and helpful place is what we call, Odoo's 'Dashboards' module! And when thinking of a way to identify it in the shortest way possible, it's simply, a dashboard that unifies all individual dashboards.
You can treat it as a workbench where the user can have the overall views of management or changes taking place in a specific environment (ie: your company). The Dashboards module is not just a module to view live data, it is also a way to analyze your business interrelated reports instead of having to print them out one by one or migrating between windows to compare all of the data until your head explodes at one point.
When handling Dashboards in Odoo, you should never neglect that to bring out the best of every module is to use its recipe in a way that benefits you on all scales, so the Dashboards' secret recipe is knowing how to use the filters for your best interest.
After installing the app, you can go to many of your modules and customize your preferred views of your report and then add them to the dashboard. For example, you would like to stay updated on your sales, purchases, and maybe invoice payments and collection per month or for a specific quarter and compare them at the same time. That could be easily done, just follow these quick steps, which apply to most of the reports on Odoo's modules.
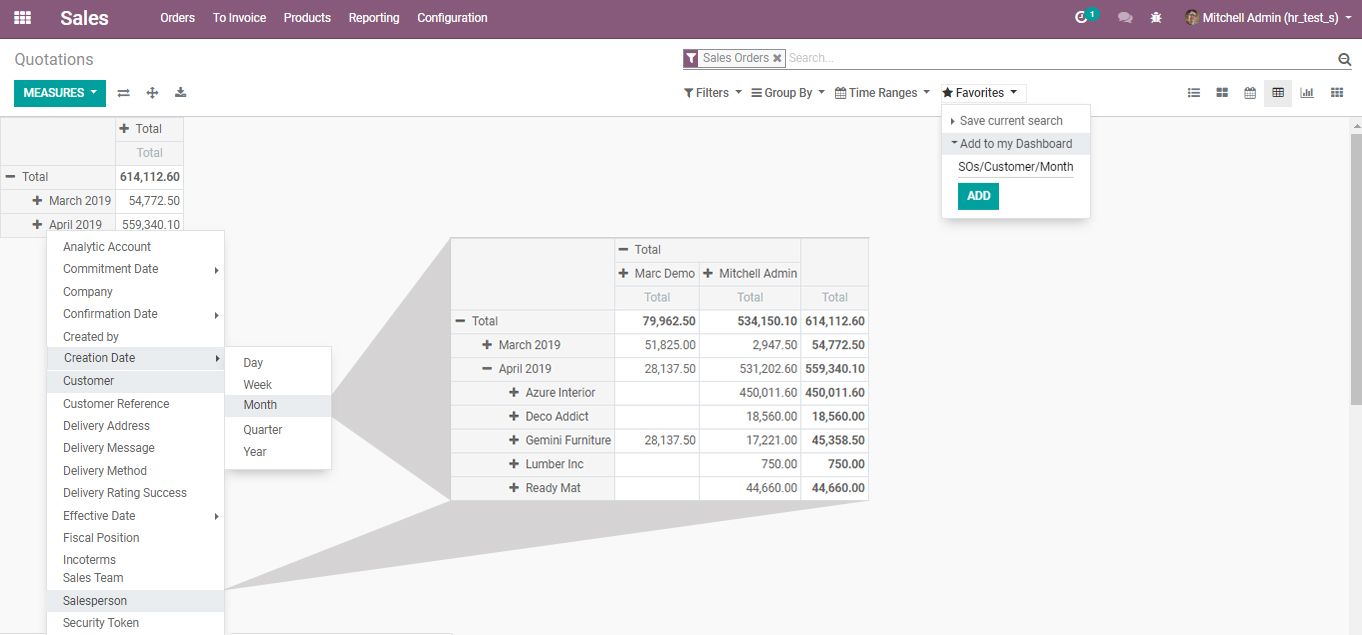
Navigate to the app from which you would like to pull a report (ie: Sales, Purchases, Accounting)
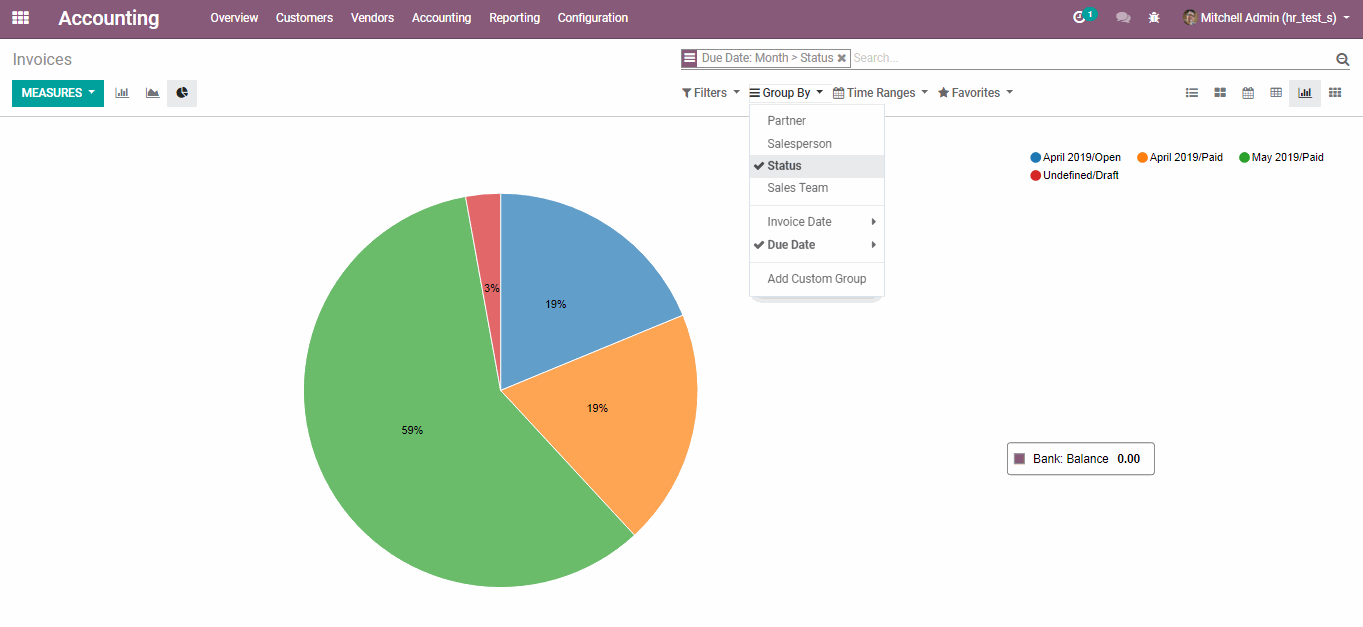
Customize your report by using the filters you think would benefit you depending on the module you have chosen (ie: Group by total sales by month, filtering SOs/POs by Salesperson/Purchase Representative, or how many invoices have been paid this specific month)
Do not forget to choose the view type you would like the data to be displayed in (ie: Pivot Table, Graphs, Charts)
When you are satisfied with your report and its filtration, navigate to 'Favorites', click 'Add to my Dashboard' and name it in whatever way you like.
Go to your Dashboards module and you will find all of the reports you have added in one place for you to view, compare and analyze comfortably.
Don't forget that you get to easily export your filtered reports to an Excel sheet and keep them for future review purposes or so on.

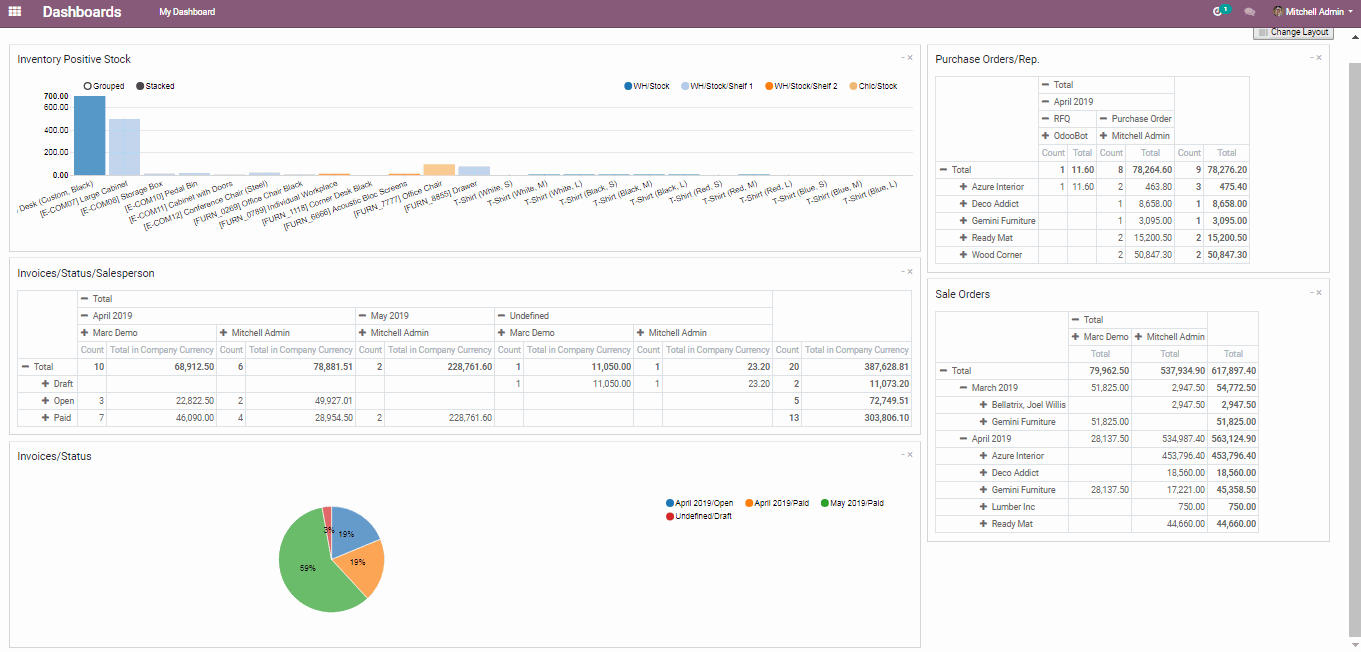
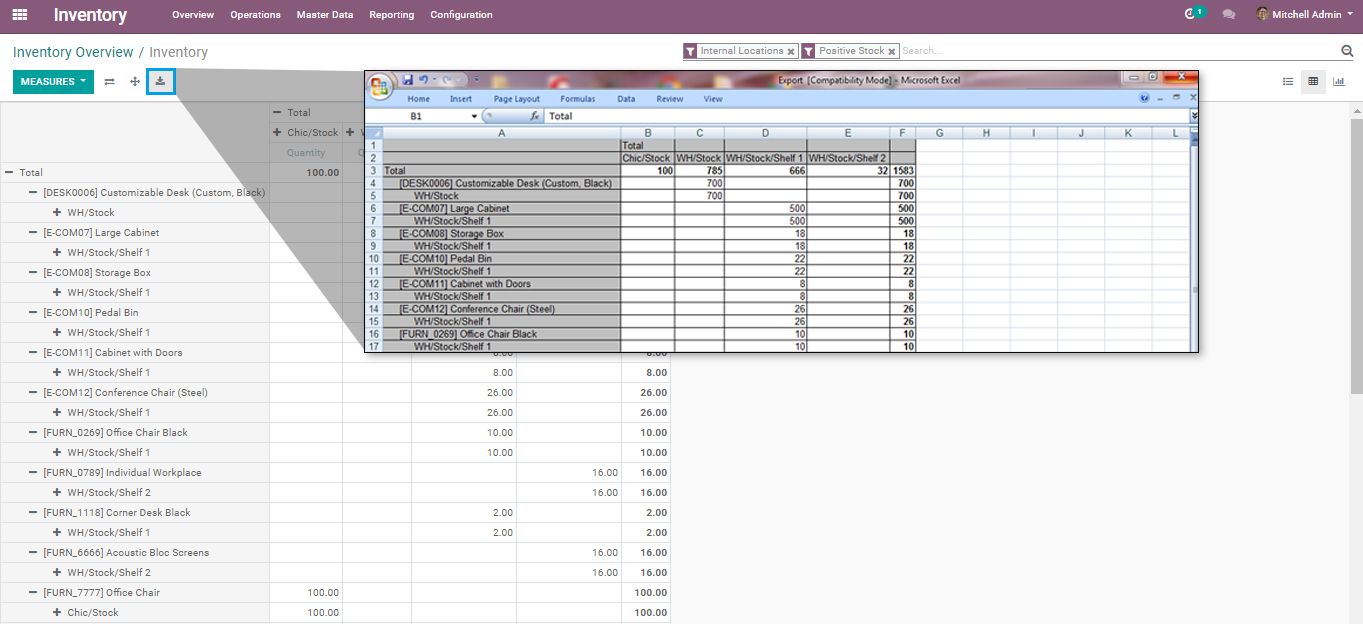
What was mentioned above or what you can see in the pictures are just a few examples of simple reports, you can make much more complex reports and save them instead of always trying to recreate them again.
Odoo has made those tricks for the purpose of making your everyday routine easier, so why not enjoy the power of these features and make your work easier?